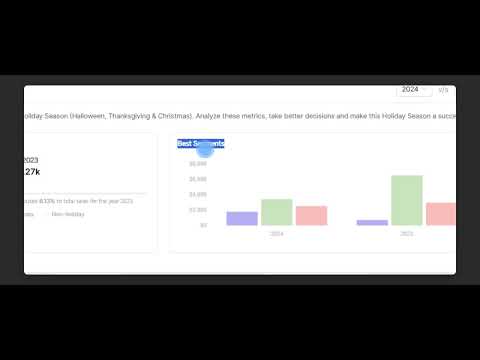
Want to know how your business performed this Holiday Season compared to last year? 🎯
In this video, we’ll walk you through Putler’s Holiday Insights Dashboard — a powerful tool that helps you compare your holiday sales performance year-over-year and uncover what truly worked for your business.
You’ll learn how to:
✅ Compare Holiday vs Non-Holiday performance (Halloween, Thanksgiving, and Christmas)
✅ Analyze key metrics like Revenue, ARPU, Conversion Rate, and Customer Trends
✅ Identify your top-performing holidays and campaigns
✅ Use insights to plan stronger promotions for upcoming seasons
Whether you’re preparing your Black Friday, Cyber Monday, or Christmas campaigns, Putler’s analytics helps you make data-driven decisions that boost results.
🔍 Try Putler today:
📈 Watch more Putler tutorials:
#Putler #HolidayInsights #EcommerceAnalytics #HolidayPerformance #SalesComparison #EcommerceGrowth #DataDrivenMarketing #PutlerTutorial #BlackFridayAnalytics #HolidaySales


Be the first to comment